
With the release of its NASCAR 25 video game early last year, NASCAR and the game’s developer, iRacing, unveiled a new driver rating system. Predictably, the ratings sparked spirited debate among fans and drivers. Unexplained amid this discussion was why iRacing didn’t apply its tried-and-true iRating system to rate NASCAR drivers in the game. With the season complete, I decided to develop my own driver rating system, called gRating, to replicate iRating by leveraging real NASCAR results.
How gRating Works
gRating, like iRating, is an Elo rating system (first invented for Chess and now used in many other sports) that measures drivers’ skill relative to one another. All drivers start at 1,350. After each race, the system compares every driver in the field. For each pair, it calculates the expected result based on their current ratings. Higher-rated drivers are expected to beat lower-rated drivers. It then compares this expectation to what actually happened (who earned more points). If a driver beats expectations (i.e., a lower-rated driver earns more points than a higher-rated one), then their rating increases; if they underperform, it decreases.
gRating offers a new quantitative metric to evaluate current drivers based on their ability to earn points, capturing underlying performance trends that may not yet be reflected in wins or standings, and helping to distinguish sustainable performance gains from short-term variance driven by schedule, luck, or execution noise. Unadjusted gRatings for two drivers can be directly compared and used to define the expected distribution of race outcomes. When two drivers have equal gRatings, they are expected to earn more points than one another at equal rates over a large sample of races. A gRating advantage shifts this expectation probabilistically: each additional 100 points roughly corresponds to earning more points in about one additional race out of ten if the same event were run repeatedly. Near parity, small gaps matter most, while larger gaps (300–400 points) primarily reduce the probability of outlier events in which a lower-rated driver outperforms a higher-rated one.
I’ve calculated gRatings for all drivers starting in 1972, the beginning of the modern era of the Cup Series. Non-points races are excluded from the dataset. gRating is integrated into galaxie.app, visible on each race’s Pre Race Stats page, as well as in the Points Table on each in-race dashboard.
Median gRating Shifts over Time
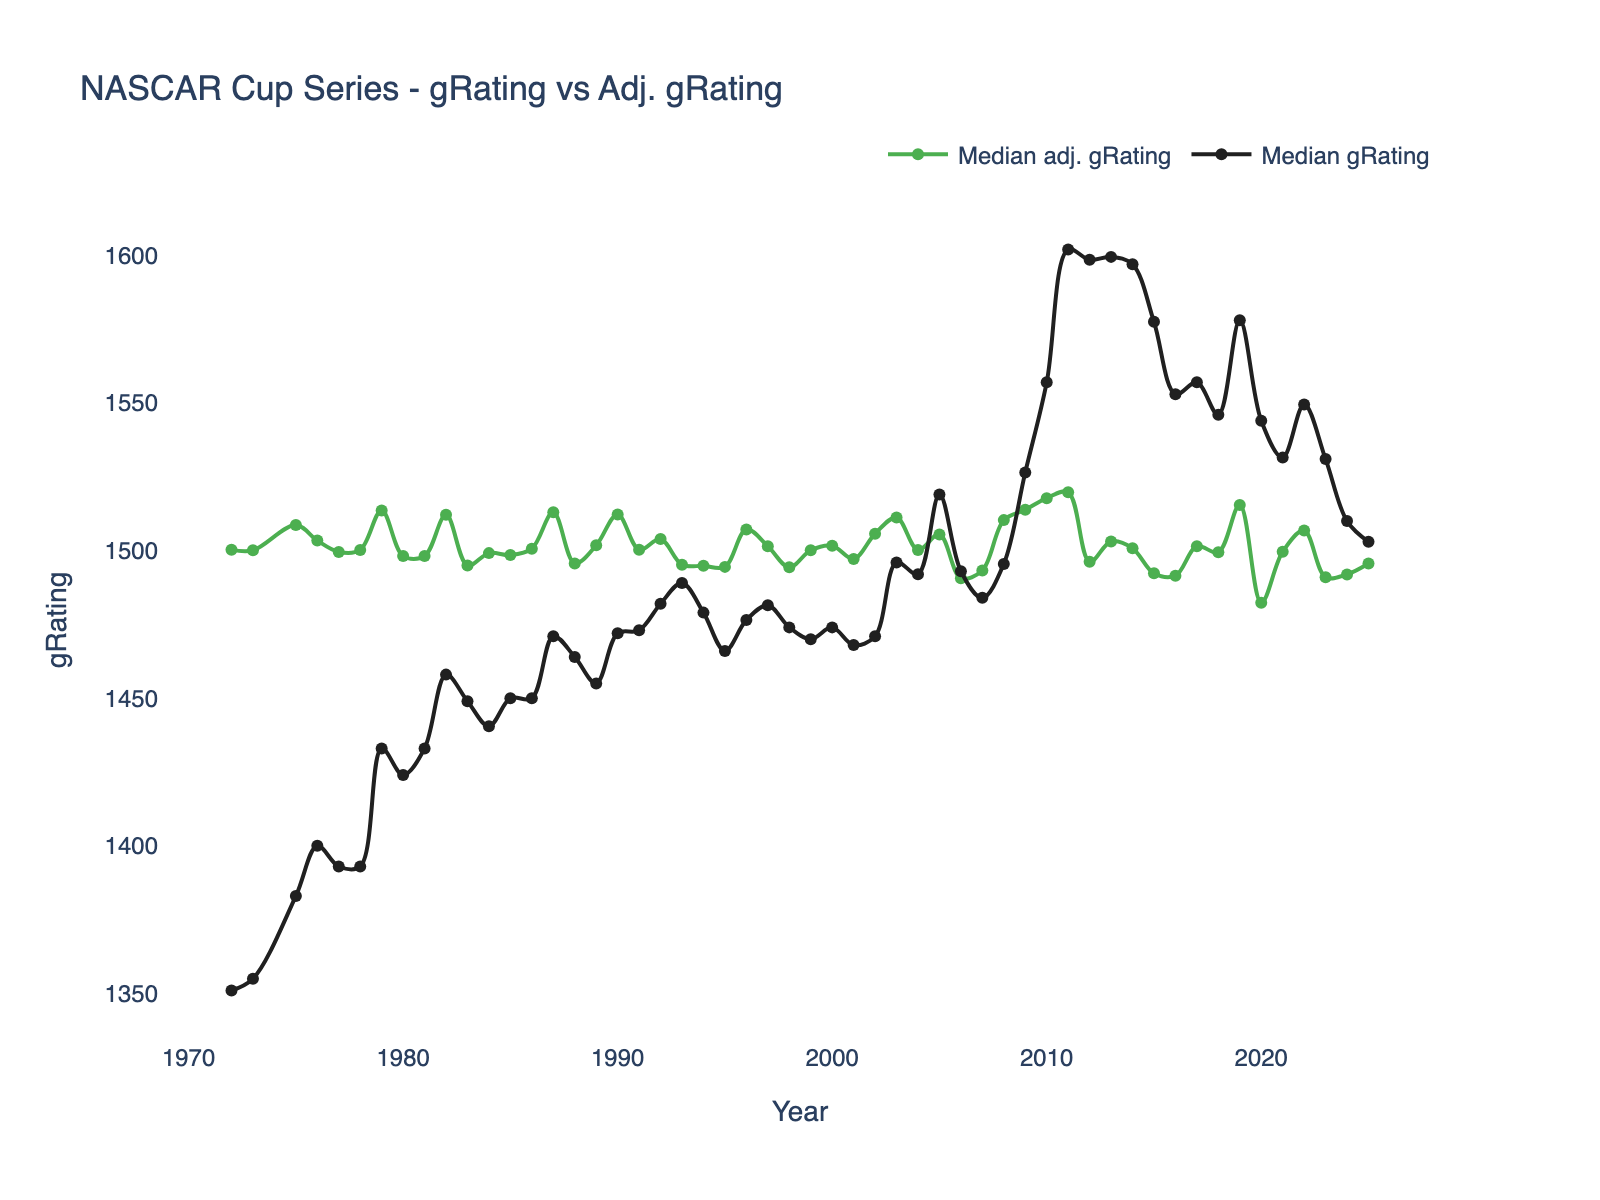
The median gRating has drifted significantly over time. In the early years of the modern era, ratings slowly climb to a median near 1,500, then explode in the late 2000s until finally settling down in the NextGen era. To effectively compare gRatings across eras, we use an adjusted gRating that measures a driver’s performance relative to the rest of the field at that moment rather than against a fixed historical scale. Each race’s gRating is centered on the rolling field median and scaled by the field’s typical spread, with additional adjustments to prevent early seasons and short careers from producing exaggerated results. This allows the adjusted gRating to reflect how strong a performance in context, independent of era. Because of these adjustments, adjusted gRating does not directly map to the probability of scoring more points.
Even with this adjustment, comparing across eras directly remains difficult. The performance of some drivers gradually declines late in their careers, while others leave the sport while still near their peak. To account for these differences, I’ve augmented gRating with gPace (gRating Performance Across Career & Era). gPace considers multiple aspects of a driver’s career gRating, including their median performance level, the rate at which they exceeded the field per race, their career trajectory, their total accumulated excess gRating, and their consistency. These components are then normalized per-race and mapped to a 0-100 scale.
Interpreting gRatings
| adj. gRating | Description |
|---|---|
| ≥ 1750 | Generational: Era-defining race strength. |
| 1700–1749 | Championship-Caliber: Legitimate title contenders with sustained race-winning strength. |
| 1600–1699 | Contender: Regularly competitive for wins and top 5s. |
| 1500–1599 | Above Average: Consistent top-10 potential. |
| 1400–1499 | Mid-Pack: Median race strength; results swing with execution, track fit, and attrition. |
| < 1400 | Back-Marker: Rarely competitive on pace alone. |
Drivers start out with a gRating of 1,350. The best up-and-comers typically quickly grow to the 1,500 range. Drivers in top-tier equipment generally sit around the 1,650 range. Drivers commonly experience their peak gRatings in the first few races of a season after a championship run. Drivers who move from mid-tier to top-tier equipment generally see their gRatings rise by about 150 points, which typically takes 1/2 to 2/3 of a season. They usually hover around their current gRating as they settle into the equipment and team, before their gRating quickly grows. From 1972 to 2002, and since 2022, drivers have rarely fallen below 1,200 gRating, as drivers would promptly be replaced if their performance was that inadequate. The exception from 2002 to 2021 aligns well with the start-and-park era; it isn’t necessarily that those drivers were so uncompetitive, just that they finished at the back of the field in nearly every race because they completed only the bare minimum laps.
Interpreting gPace
| gPace | Description |
|---|---|
| ≥ 90 | Generational: Sustained, era-defining front-running speed across multiple seasons. |
| 85–89 | Championship-Caliber: Long-term race-winning speed typical of multi-season title contenders. |
| 75–84 | Strong: Consistent competitive speed with credible peak seasons near the front. |
| 55–74 | Above-Average: Better-than-median speed; competitive when conditions align. |
| 35–54 | Mid-Pack: Career defined by median pace; outcomes depend heavily on execution and context. |
| < 35 | Back-Marker: Persistently off the front-running pace. |
gPace is a career-oriented metric and captures drivers’ performance across their entire careers. It aims not to penalize drivers whose peak performance is bracketed by stints in backmarker cars and accounts for changes in field strength over time. It doesn’t consider championships, just pure race results. gPace differences are non-linear: near the extremes, small gaps reflect larger performance differences, while in the middle, similar scores can indicate comparable careers. A 5-point gap between 85 and 90 is more meaningful than between 50 and 55, since the scale compresses in the middle and expands at the extremes.
The Top 15 Drivers by gPace
| Driver | Seasons | # of Races | Peak gRating | Peak adj. gRating | gPace |
|---|---|---|---|---|---|
| Jeff Gordon | 1992 – 2016 | 805 | 1,861 | 1,962 | 95.52 |
| Dale Earnhardt | 1976 – 2001 | 673 | 1,801 | 1,919 | 95.21 |
| Mark Martin | 1981 – 2013 | 880 | 1,806 | 1,995 | 95.13 |
| Tony Stewart | 1999 – 2016 | 618 | 1,782 | 1,833 | 92.67 |
| Denny Hamlin | 2005 – 2025 | 719 | 1,840 | 1,816 | 92.60 |
| Kevin Harvick | 2001 – 2023 | 824 | 1,858 | 1,813 | 92.28 |
| Jimmie Johnson | 2001 – 2025 | 699 | 1,809 | 1,859 | 91.86 |
| Rusty Wallace | 1980 – 2005 | 705 | 1,736 | 1,832 | 90.91 |
| Joey Logano | 2008 – 2025 | 612 | 1,858 | 1,759 | 89.80 |
| Bobby Allison | 1972 – 1988 | 447 | 1,724 | 1,831 | 88.93 |
| Kyle Busch | 2004 – 2025 | 748 | 1,854 | 1,816 | 88.88 |
| Chase Elliott | 2016 – 2025 | 351 | 1,803 | 1,817 | 88.20 |
| Kyle Larson | 2014 – 2025 | 396 | 1,807 | 1,796 | 88.05 |
| Jeff Burton | 1993 – 2014 | 695 | 1,761 | 1,892 | 85.79 |
| William Byron | 2018 – 2025 | 286 | 1,749 | 1,809 | 85.56 |
Full-Time Active Drivers in Bold.
Jeff Gordon just pips Dale Earnhardt for first in the top drivers ranking, driven by much higher career consistency and a stronger excess gRating across nearly 25 seasons. Jimmie Johnson sits lower than expected in 7th, likely influenced by both his and career crew chief Chad Knaus’s emphasis on optimizing for the Chase format and by the long post-peak tail of his career. Tony Stewart and Kevin Harvick also fall just below the top tier, reflecting careers defined by adaptability and reinvention across eras, not by uninterrupted, race-to-race dominance at the very top of the field.
Six of the drivers are active, with all but Kyle Busch still in peak form. Denny Hamlin and William Byron are the only active drivers who have yet to win a championship. While Denny ranks 5th overall and best among active drivers, he has not yet eclipsed Mark Martin as the best driver never to win a championship. Jeff Burton is the last driver on the list to have never won a championship. Denny, Mark, and Jeff’s inclusion on the list underscored that sustained week-to-week strength is more critical to gPace than championship wins. Methodologically, gPace and the adjusted gRating favor drivers who combined high peaks with long-term consistency, elevating careers like Gordon and Martin while tempering drivers whose resumes were shaped more by short peak windows, format optimization, or pronounced late-career decline.
Current Drivers gRating
gRatings are a great tool for Let’s dive into the 2025 season. And the top 10 current Cup Series drivers by adjusted gRating see how their careers evolved.
| Driver | gPace | Current unadjusted gRating | Current adj. gRating |
|---|---|---|---|
| Christopher Bell | 83.86 | 1,728 | 1,818 |
| Kyle Larson | 88.05 | 1,701 | 1,796 |
| Ryan Blaney | 84.93 | 1,679 | 1,761 |
| Joey Logano | 89.80 | 1,660 | 1,740 |
| Chase Elliott | 88.20 | 1,657 | 1,727 |
| William Byron | 85.56 | 1,653 | 1,718 |
| Denny Hamlin | 92.60 | 1,638 | 1,707 |
| Chase Briscoe | 65.19 | 1,649 | 1,700 |
| Tyler Reddick | 71.36 | 1,645 | 1,699 |
| Chris Buescher | 54.71 | 1,606 | 1,651 |
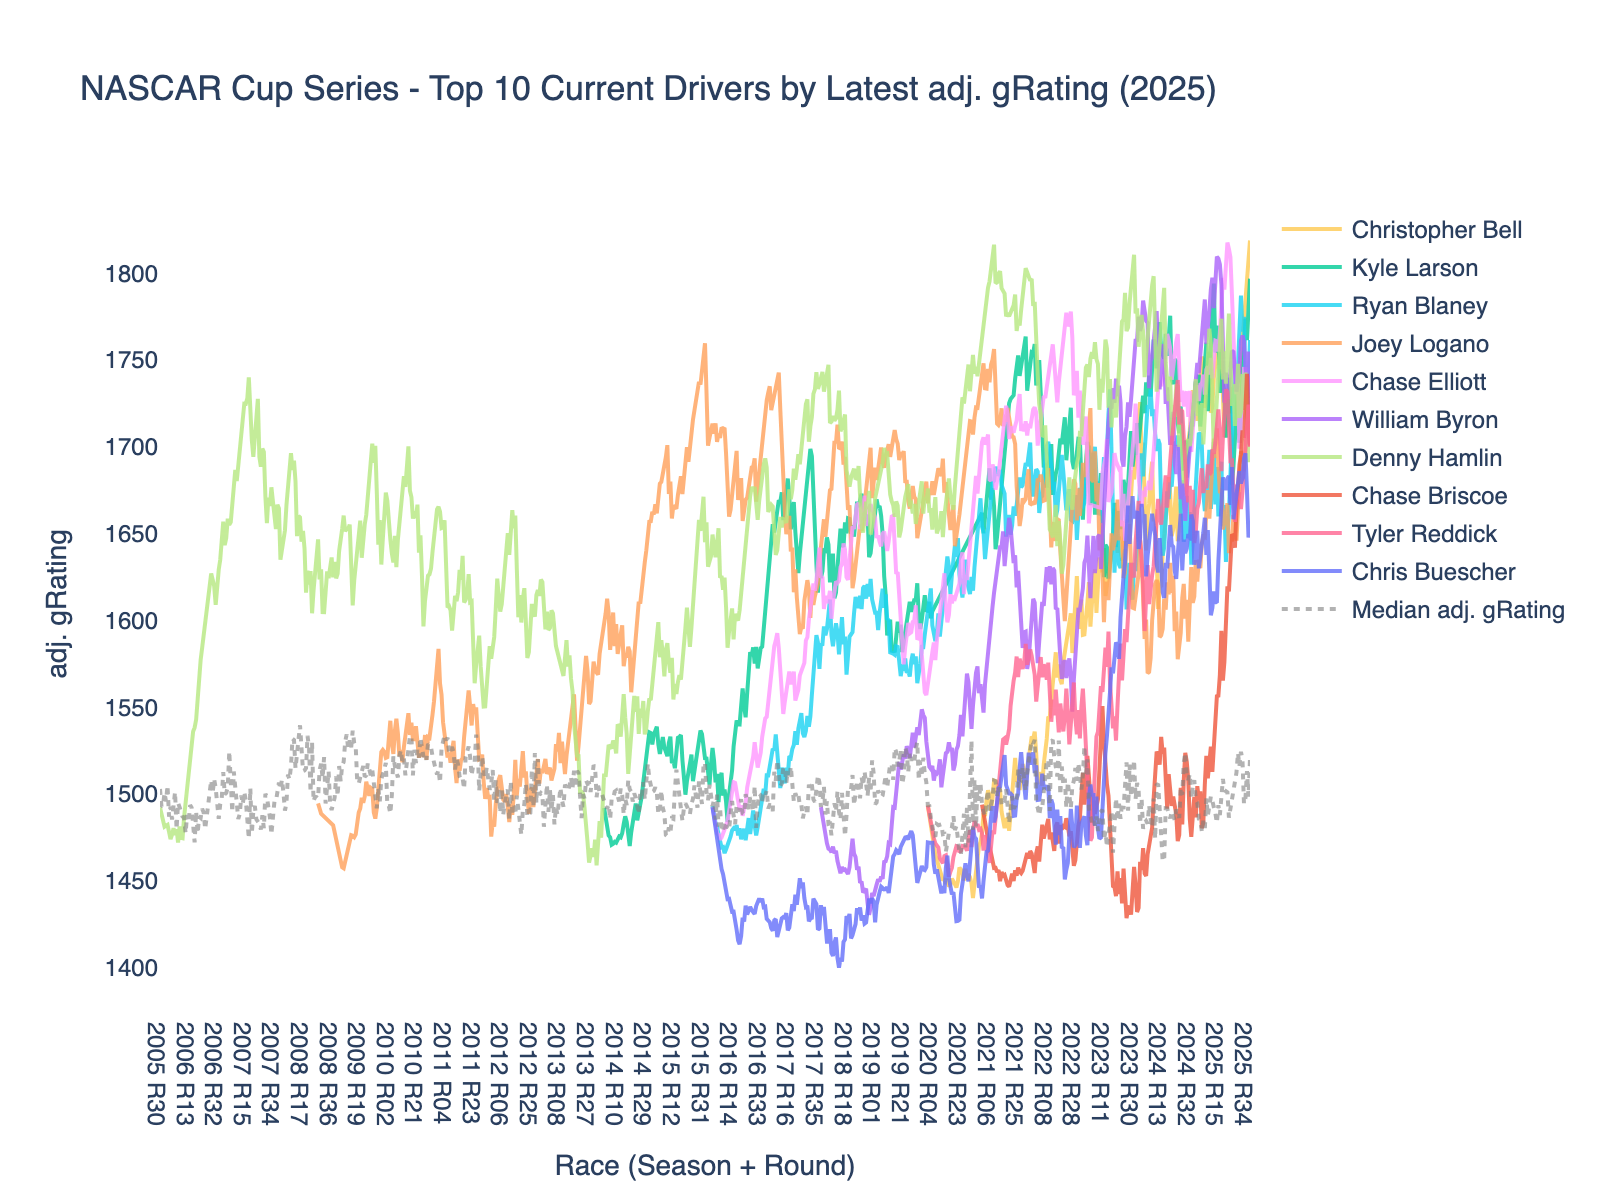
Double-Click on a Driver’s Legend entry to focus on their career.
Overall, the convergence through 2024 and 2025 highlights the increased parity of the NextGen era, where marginal gains in execution and organizational strength now separate the very best from the rest. Chase Briscoe’s steep rise in the 2025 season shows just how intrinsically linked results are to equipment, while Chris Buescher’s jump in the middle part of 2023 demonstrates the extent to which RFK reinvented itself in the NextGen era. Kyle Larson, Chase Elliott, Joey Logano, and Denny Hamlin each have pronounced peaks tied to championship-caliber seasons, followed by a normalization rather than a collapse, suggesting true elite ceilings even when results fluctuate.
Leave a Reply